Most yards have data.
The problem is trusting it.
57% of logistics professionals report at least one blind spot in their yard — even when they’re already using a yard management system. This calculator estimates how much value isn’t being captured today because of that gap.
Yard blindness isn’t about missing technology. It’s about missing confidence.
“Yard blindness stems from a lack of confidence in data, not the absence of it.”
The issue isn’t whether data exists. It’s whether teams trust it enough to act on it. When yard managers can’t fully trust the information in front of them, they take extra steps to verify it — manually rechecking locations, confirming status, searching for assets before moving them. Work that should flow starts to slow. People spend more time confirming what’s happening, and less time directing what should happen next.
See how much value your yard is positioned to capture
Answer a few questions about your yard. Every number is derived from your inputs using Aviro360 customer benchmarks — giving you the confidence to know what complete visibility is actually worth.
$400,000 guard shack construction avoided
- Gate delays creating downstream bottlenecks that compound across the shift
- Manual trailer location consuming spotter time that could move freight instead
- Dwell time accumulating without active monitoring or early exception alerts
- Manual check-in and documentation creating rework and administrative variability
How these opportunity estimates are calculated
All estimates are derived from your inputs using benchmarks observed across Aviro360 customer deployments. No figure in this calculator comes from a static industry average — every number is computed from what you've told us about your operation.
Labor savings are calculated as: operating days × (gate staff + spotters) × shifts × fully loaded labor rate × 80% capture coefficient. The 80% reflects that not all labor is eliminated — some staff shift to higher-value work rather than being removed entirely.
Dwell and detention reduction is calculated as: operating days × daily truck volume × dwell cost per hour × 8 minutes saved per event. The dwell rate ($50/$75/$100/hr) reflects your selected exposure level. Eight minutes per event is the observed average gate time reduction across Aviro360 deployments.
Asset search time reduction is calculated as: operating days × 35% of daily moves × (equipment + labor cost per hour) × 8 minutes saved per locate event. The 35% coefficient reflects observed search frequency across yard operations where asset location is not continuously tracked.
Error and admin workload reduction is calculated as: operating days × fully loaded labor rate × 70% reduction in manual rework. This reflects elimination of manual check-in documentation, exception logging, and paperwork reconciliation that Aviro360 automates.
Shrinkage and spoilage reduction is estimated as a percentage of annual cargo value, weighted by facility type. Food and beverage operations carry a higher rate (0.20%) reflecting temperature-sensitive freight risk. BCO operations (0.03%) reflect manufacturing and distribution inventory exposure. All other facility types use 0.01% as a conservative baseline. Actual results vary by site conditions, volume, and operational maturity.
Research basis: The statistics cited on this page are from the Aviro360 State of Real-Time Yard Visibility report, based on a quantitative survey of 367 U.S.-based logistics professionals conducted between November 24 and December 19, 2025. All respondents held logistics-related roles with direct or indirect responsibility for yard operations and managed at least two yards.
The gap isn’t in your system. It’s in your confidence in it.
Our research found that 54% of operations that recently upgraded their YMS still report blind spots. The issue isn’t the technology — it’s that yard management systems record transactions, not what happens between them. Every move, dwell event, and gate interaction that occurs outside a workflow creates a gap — and gaps erode data confidence.
Unreliable starts create cascading uncertainty
When entry and exit events aren’t captured consistently, operators lose confidence in their understanding of what’s actually on site. 51% of professionals report gate blind spots — an unstable starting point that makes everything downstream harder to trust.
Verification mode replaces execution mode
When yard teams can’t fully trust asset location data, they shift into verification mode — manually confirming what the system says before sending anyone to move anything. 43% report location and readiness blind spots that force this every day.
Small gaps create large performance deficits
Gate blind spots and yard blind spots reinforce each other. Imperfect entry data makes location data less trustworthy. Less trustworthy location data means more manual verification. More verification means slower execution, more congestion, and more cost.
How operations teams capture this value
Each category in the calculator above maps to a specific capability. Aviro360 addresses each one by giving teams the data confidence to act without stopping to verify — not by replacing your YMS, but by filling the gaps it leaves.
Automate gate check-in and validation
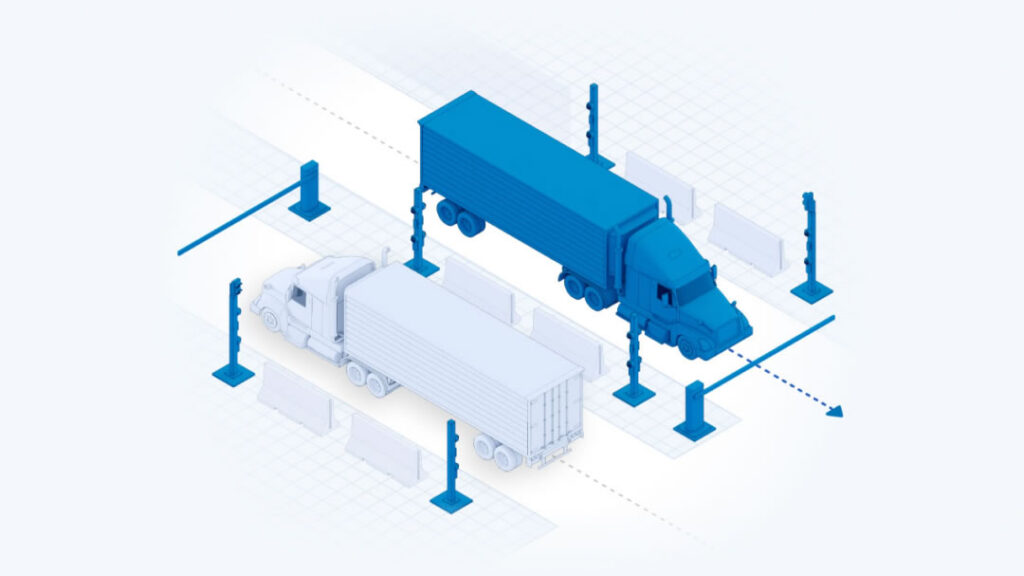
AI identifies vehicles, validates credentials, and processes arrivals automatically — eliminating gate headcount and reducing check-in time from minutes to seconds. Every event is captured the moment it happens.
Track every asset continuously from gate to departure
Real-time location data across every trailer, container, and chassis — updated automatically as hostlers and stackers move them. Location becomes something you can trust, not something you need to verify.
Surface dwell before it becomes detention
Dwell time is monitored live. Exceptions are flagged before fees accrue and before freight misses its window. Patterns surface automatically so you can see where flow consistently breaks down.
Create a complete, auditable record of every move
Every gate event, asset move, and access decision is documented automatically — giving your team the data confidence that our research shows is the real lever for operational performance.
Ready to see where this shows up
in your operation?
Your inputs suggest — in annual value not currently being captured. We can walk your site, review your operation, and show you exactly where that confidence gap lives — and what closing it looks like.
Walk your site with us